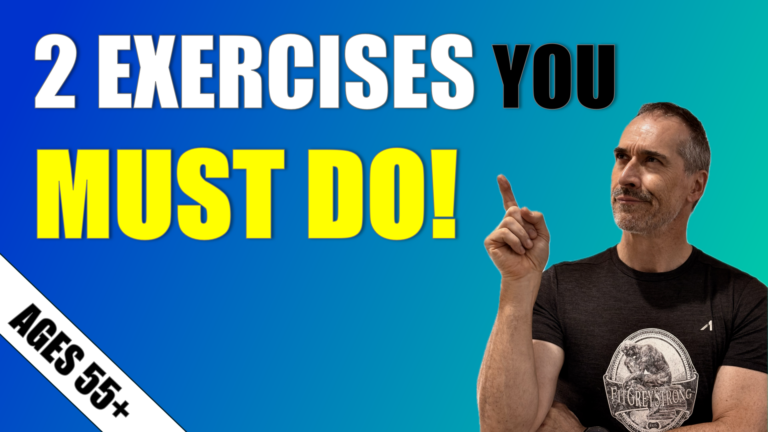
Tag Archives: Health

12 Reasons Why Older Adults Need To Do Resistance Training Exercise: Part 1

Share this:

What are they:

  1. Increases longevity and improves quality of life
  2. Helps manage hypertension and decreases heart disease
  3. Enhances sleep quality and quantity
  4. Prevents/treats type 2 diabetes & decreases inflammation
  5. Prevents cognitive decline & neurodegenerative disease
  6. Improves mental health 
  7. Enhances skeletal health
  8. Maintains or increases lean body mass (muscle)
  9. Increases strength, power, speed and physical function
  10. Reduces body fat and help maintain body fat loss
  11. Improves endurance performance 
  12. Reduces injury risk

Resistance or weight training is a critical component of training programs of most elite athletes irrespective of the sport. The benefits of resistance training – to increase maximal muscle strength and neuromuscular power – has long been recognised by most strength and conditioning experts, coaches and sport scientists as key to sporting performance. Logic would dictate therefore that if elite athletes are doing concurrent training to improve sport specific performance, masters athletes may also reap huge benefits too. There is now compelling evidence to suggest that resistance training can potentially augment athleticism of masters athletes well beyond that achieved by confining training to sports specific training. Furthermore, these significant benefits are not just limited to sprint, speed or power orientated sports but endurance performance may also be enhanced.

However, before I address the athletic performance benefits of resistance training for older athletes and functional enhancement such exercise has in older non-athletes (these will be outlined in part 2), I want to discuss the significant and sometimes life-changing health benefits that have been well documented in research conducted over the last 20 years. There is a great deal of data now to support the use of resistance training to help treat and manage a number of chronic diseases that become more prevalent as we get older. The following outlines 6 key reasons why resistance training exercise should be included in all programs of older athletes and exercise programs of older non-athletes.


strength training for over 50
Resistance Training Reduces The Risk Of Death

Reduce the risk of death. Evidence continues to accumulate to show that skeletal muscle strength is strongly predictive of longevity. Maximum muscle force in men aged 20-80 is independently and inversely associated with all-cause mortality. Over the age of 60 years, all cause and cancer-associated mortality is twice as likely in individuals with low compared to high skeletal muscle strength. Older adults over 15 years who reported twice/weekly strength training had 46% lower odds of all-cause mortality than those who did not. Resistance training when performed regularly is one of the best methods to increase skeletal muscle strength (see links 1, 2, 3, 4). A recent assessment of the research that has been conducted in older adults showed that resistance training substantially improved health-related quality of life. In other words, resistance training and getting stronger has a direct impact on our perception of how meaningful, manageable and comprehensible life is, and as such, significantly greater promotion of this type of activity is warranted (see here).


strength training for over 50
Resistance Training And Cardiovascular Health

Helps manage hypertension and decrease heart disease. High blood pressure can still affect masters athletes and resistance training when performed in conjunction with aerobic or endurance training has been shown to have a positive effect and reduce blood pressure. However, data to support resistance training as a stand alone practice is mixed with some studies suggesting improvement in systolic and diastolic blood pressure versus other research that has shown such exercise can increase arterial stiffness. Evidence tends to point to concurrent exercise (resistance training combined with aerobic exercise) as being the most effective for reducing the risk of heart disease (see links 1, 2, 3, 4).


strength training for over 50
Resistance Training Facilitates Better Sleep

Improves sleep quality and quantity. Problems with sleep are common with advancing years and occur in over half of adults age 65 and older. It has been estimated that insomnia affects about a third of the older population. The evidence to date suggests that poor sleep hygiene directly impacts and worsens many aspects of health including such things as mental health, obesity, heart disease, cognition, memory, executive function, metabolic disturbance and falls to name just a few.

Overall quality of life is thus dramatically reduced. Other factors associated with ageing, such as disease, changes in environment, or concurrent age-related processes also may contribute to problems of sleep. Sleep disturbance and long sleep duration, but not short sleep duration, have been shown to be associated with increases in markers of systemic inflammation. Research has shown that both sleep quality and quantity is improved with increased levels of exercise. Resistance training alone appears to positively impact sleep quality but more data is required to confirm that sleep quantity is equally improved (see links 1, 2, 3).


strength training for over 50
Diabetes Rates Continue To Increase

Prevent/treat type 2 diabetes & decrease inflammation. Type 2 diabetes mellitus (T2DM) is one of the fastest growing non-communicable diseases worldwide and occurs much more frequently in those that are overweight and obese. However, impaired blood glucose metabolism, one of the hallmarks of T2DM, is an increasingly common problem in those that are not overweight and have relatively normal BMI.  A poor and overindulgent diet – high in things like sugar, trans-fats, processed foods, junk foods and that are low in fish (omega-3 fatty acids), vegetables, fruit, fibre and high quality protein – combined with long-term sedentarism has been postulated as playing a leading causative role. Such a combination causes the development of chronic positive energy balance whereby excess energy disposal and adipose storage triggers a significant oxidative pro-inflammatory response referred to as metabolic inflammation.

In obesity, expanding adipose tissue attracts immune cells creating an inflammatory environment within this fatty acid storage organ. Skeletal muscle is the predominant site of insulin-mediated glucose uptake and insulin resistance is considered the primary defect that is evident years before the development of T2DM. Resistance training has consistently been shown to improve the ability of the skeletal muscles to take up and metabolise blood glucose (sugar) and is therefore an important strategy in managing T2DM. Finally, there is now scientific data to show that disorders that arise and are linked to inflammation (e.g. Insulin resistance, obesity, cardiovascular disease, diabetes, cancer, chronic kidney disease, osteoarthritis, Alzheimer’s disease and many more), can be improved or mitigated with resistance training and exercise (see links 1, 2, 3, 4, 5).


strength training for over 50 female
Resistance Training Enhances Brain Health

Prevent cognitive decline & neurodegenerative disease Recent research has shown that long-term resistance training in older women promotes executive function, memory, reduced cortical white matter atrophy and increased peak muscle power. Such findings are very exciting as they suggest that exercise and resistance training can modify brain neuroplasticity and help improve brain function. The current thinking is that resistance and physical exercise represents a promising nonpharmaceutical intervention to prevent age-related cognitive decline and neurodegenerative diseases such as dementia and Alzheimers. There is some evidence that the mechanisms behind these alterations may be related to increased levels of Brain-derived neurotrophic factor (BDNF) and IGF-1. BDNF-induced neuroplasticity is speculated to be facilitated by physical exercise but conclusive evidence supporting this mechanism of action has not yet been established (see links 1, 2, 3, 4).


strength training for over 50 female
Mental Health Is Significantly Improved with Resistance Training

Improved mental health. There is substantial evidence to demonstrate that resistance training and exercise more generally has a very dramatic and potent effect on improving mental health and treating those that suffer from mental health disorders. For example, research has shown that high-intensity resistance training is more effective than low-intensity resistance training or standard care by a GP in the treatment of depression in older patients. Resistance exercise has also be shown to reduce anxiety, slow the progression of white matter lesions in older women, improve symptomatology and disease severity in severe mental illness and essentially improve overall quality of life and general mental health (see links 1, 2, 3).

To finish up I cannot emphasise enough just how important resistance training exercise is for all older adults including masters athletes. The reasons mentioned above are only some of the many that support resistance training exercise as an essential ingredient of a healthy lifestyle and confirm current recommendations for people to partake in a minimum of 2 resistance training sessions per week.

To read part 2 of “12 reasons why older adults need to do resistance training exercise” which discusses the performance-enhancing benefits for older athletes and the incredible functional improvements that can be achieved in older non-athletes, see here.


For local Townsville residents interested in FitGreyStrong’s Exercise Physiology services or exercise programs designed to achieve the above-mentioned benefits or to enhance athletic performance, contact FitGreyStrong@outlook.com or phone 0499 846 955 for a confidential discussion.

For other Australian residents or oversees readers interested in our services, please see here.


Disclaimer: All contents of the FitGreyStrong website/blog are provided for information and education purposes only. Those interested in making changes to their exercise, lifestyle, dietary, supplement or medication regimens should consult a relevantly qualified and competent health care professional. Those who decide to apply or implement any of the information, advice, and/or recommendations on this website do so knowingly and at their own risk. The owner and any contributors to this site accept no responsibility or liability whatsoever for any harm caused, real or imagined, from the use or distribution of information found at FitGreyStrong. Please leave this site immediately if you, the reader, find any of these conditions not acceptable.


© FitGreyStrong
Share this:

7 Things that Will Surprise You About Meditation Retreats

Share this:
Image credit: Benjamin Balazs (Pixabay)

If you’ve been thinking about joining a spiritual retreat in Queensland, Australia or a meditation retreat anywhere else on the planet, you probably have some preconceived ideas about what will happen while you’re there. A National Health Interview Survey found that 8 percent, or 18 million, American adults, have practiced meditation, most of whom use it outside of traditional cultural or religious settings.

Perhaps you envision everyone sitting silently in the lotus position on straw mats wearing crystals, as you try your hardest not to laugh. That vision is likely to be far from the reality, in fact, there are quite a few things that will surprise you about attending a meditation retreat.

A Meditation Retreat Can Be Whatever You Want it to Be

Many meditation retreats offer plenty of flexibility and freedom – your days aren’t structured around a strict schedule but tailored to your particular needs. You can often choose from both relaxation and active pursuits, like swimming, biking, hiking, kayaking, dance, restorative yoga and even big thrills such as zip-lining or swinging through the tops of soaring trees on a giant swing.

Meditation Isn’t Just Sitting

It’s difficult to sit in one position all day long as the body simply isn’t use to sitting motionless for long periods of time. Most retreats include periods of sitting meditation as well as walking meditations. Walking will give your body the chance to unfold and stretch.

You Can Laugh

A meditation retreat isn’t all serious. In fact, laughing is encouraged. Some say it’s a requirement while meditation is the option.

You Don’t Have to Give Up Everything Good

While most meditation retreats offer plenty of healthy meals and are alcohol free, you don’t have to give up everything that’s good. Vegans and vegetarians are likely to find plenty of options, but you don’t have to follow a strict diet. Expect organic, colorful and delicious meals that will provide the fuel your mind and body needs to make the most out of the experience. Meditation after the retreat is meant to add to your life, not take from it. As you practice it’s likely to influence you to make healthier choices, but that doesn’t necessarily mean no more chocolate, coffee, sex and/or alcohol forever.

You Don’t Have to Be an Experienced Meditator

Many guests are brand new to meditating when they arrive at a retreat – it doesn’t matter if you’re a beginner and have never tried it before, or if you’ve been practicing for years. It’s ideal for everyone and a meditation retreat can be a great first step, or a great next step.

You Can Chant, Sing or be Silent

There’s no one proper way to meditate, it’s all up to you. Most retreats allow you to be silent or to use both your inner and outer voices, chanting or singing.

You Don’t Need a Meditation Wardrobe

You don’t have to go out and spend hundreds of dollars on a whole new meditation wardrobe. The goal is to be comfortable, which means what you wear is your own definition of comfort.

Final comments

The FitGreyStrong philosophy encapsulates a full rounded lifestyle approach to improving health, wellbeing and quality of life. Meditation is one key component of that approach that, when done regularly, can significantly contribute to healthy ageing.

Disclaimer: All contents of the FitGreyStrong website/blog are provided for information and education purposes only. Those interested in making changes to their exercise, lifestyle, dietary, supplement or medication regimens should consult a relevantly qualified and competent health care professional. Those who decide to apply or implement any of the information, advice, and/or recommendations on this website do so knowingly and at their own risk. The owner and any contributors to this site accept no responsibility or liability whatsoever for any harm caused, real or imagined, from the use or distribution of information found at FitGreyStrong. Please leave this site immediately if you, the reader, find any of these conditions not acceptable.

© FitGreyStrong


Share this:

Don’t believe everything you watch, even if it is a TED talk….

Share this:

Recently my scientific curiosity was piqued after watching this edited short piece from the TED talk by Susan Pinker. Her presentation titled “The secret to living longer may be your social life” explored (as described in the video) the “least to strongest predictors of reducing your chances of dying”. Now let me be clear. It not my intention to dispute the central argument of Pinker’s presentation, which is that strong social relationships, good social integration and minimal social isolation are all critically important to our wellbeing, as the data shows that this is so. What I do want to contest, however, is her claims made regarding the effects of exercise on mortality, as this is what primarily interests me as an Exercise Scientist. I wanted to confirm that what was presented actually reflects the current body of evidence and the latest science published in this area. My contention is that what she presented in the abovementioned TED talk does not in fact do this. I have not researched whether the effect sizes purported for other parameters (such as smoking, alcohol, obesity etc) hold up. I did initially suspect that the effect size reported for exercise was outdated. After assessing the research and literature, there are a number of erroneous claims made and outdated science used that, in my opinion, require critique and comment.

Pinker cites the work of Julianne Holt-Lunstad and states the following (taken directly from the transcript):

6:22

Now, these centenarians’ stories along with the science that underpins them prompted me to ask myself some questions too, such as, when am I going to die and how can I put that day off? And as you will see, the answer is not what we expect. Julianne Holt-Lunstad is a researcher at Brigham Young University and she addressed this very question in a series of studies of tens of thousands of middle aged people much like this audience here. And she looked at every aspect of their lifestyle:their diet, their exercise, their marital status, how often they went to the doctor, whether they smoked or drank, etc. She recorded all of this and then she and her colleagues sat tight and waited for seven years to see who would still be breathing. And of the people left standing, what reduced their chances of dying the most? That was her question.

07:19

So let’s now look at her data in summary, going from the least powerful predictor to the strongest.OK? So clean air, which is great, it doesn’t predict how long you will live. Whether you have your hypertension treated is good. Still not a strong predictor. Whether you’re lean or overweight, you can stop feeling guilty about this, because it’s only in third place. How much exercise you get is next, still only a moderate predictor. Whether you’ve had a cardiac event and you’re in rehab and exercising,getting higher now. Whether you’ve had a flu vaccine. Did anybody here know that having a flu vaccine protects you more than doing exercise? Whether you were drinking and quit, or whether you’re a moderate drinker, whether you don’t smoke, or if you did, whether you quit, and getting towards the top predictors are two features of your social life. First, your close relationships. These are the people that you can call on for a loan if you need money suddenly, who will call the doctor if you’re not feeling well or who will take you to the hospital, or who will sit with you if you’re having an existential crisis, if you’re in despair. Those people, that little clutch of people are a strong predictor, if you have them, of how long you’ll live. And then something that surprised me, something that’s called social integration. This means how much you interact with people as you move through your day.How many people do you talk to? And these mean both your weak and your strong bonds, so not just the people you’re really close to, who mean a lot to you, but, like, do you talk to the guy who every day makes you your coffee? Do you talk to the postman? Do you talk to the woman who walks by your house every day with her dog? Do you play bridge or poker, have a book club? Those interactions are one of the strongest predictors of how long you’ll live.

Comments:

The 2 studies cited in the footnotes (notes and references) section in support of Pinker’s claims regarding the above are the following: a) Social relationships and mortality risk: A meta-analytic review,” Holt-Lunstad, Julianne, Smith, Timothy R., and Layton, Bradley J, PLOS Medicine, 2010 and b) “Loneliness and Social Isolation as Risk Factors for Mortality,” Julianne Holt-Lunstad, Perspectives on Psychological Science, 2015. Both these studies were meta-analytical reviews conducted to determine the extent to which social relationships and social isolation influence risk for mortality. They clearly and rightly show that the quality and strength of the social relationships, social integration and social isolation that we experience are key determinants and predictors of premature death.

However, Holt-Lunstad’s research and her meta-analytical studies did not directly collect, analyse or assess the impact of diet, exercise, obesity, alcohol, smoking etc over a 7-year period on mortality as claimed by Pinker. This data was extracted from other meta-analyses that were performed by other researchers.

Let’s look at the graph that Pinker uses to illustrate her argument.

least to strongest predictors of reducing your chances of dying
Susan Pinker: “What reduces your chances of dying the most?”

The graph used by Pinker in her presentation is a modification of this graph (see below and click on for a clearer image) from the paper Social relationships and mortality risk: A meta-analytic review,” Holt-Lunstad, Julianne, Smith, Timothy R., and Layton, Bradley J, PLOS Medicine, 2010

The secret to living longer may be your social life
The evidence used for exercise and mortality

As you can see the effect sizes for things like smoking, alcohol, exercise, obesity have not been derived from Julianne Holt-Lunstad’s primary research. These have been extracted from other meta-analyses that Holt-Lunstad had nothing to do with. You can see the letters against each predictor (eg smoking) and the associated reference with the effect size taken from this. Figure 6 was created to compare and contrast how important social relationships and connections are to us, with other well known influencers and determinants of mortality.

As an Exercise Scientist I was particularly curious by Holt-Lunstad’s ranking of exercise in the least to strongest predictors graph as depicted in her paper and was very keen to have a look at this research given that the claims promulgated by Pinker hinges on this evidence.

As you can see in the picture above (highlighted in yellow) the effect size used for exercise was taken from this study: Katzmarzyk, Janssen, and Ardern, 2003 [210]. A 15-year-old meta-analysis. Here’s a screenshot of the reference list with the highlighted study used to rank exercise in Pinkers graph above.

The secret to living longer may be your social life
A 15-year-old meta-analysis was used as evidence

The key questions in my mind are:

  • Does the Katzmarzyk et al. (2003) meta-analysis still represent and reflect the best and most robust evidence currently available?
  • Has there been any additional research since 2003 that has changed our understanding regarding the impact of exercise on all-cause, CVD-related and cancer-related mortality?
  • Is the graph that Pinker hinges her “least and strongest predictors of how long you’ll live” argument on, still hold up?

The simple answers to these questions I believe, are no, yes and no.

One of the big changes in exercise research over the last decade or so is the development of, and refinement in how accurately physical activity and exercise can be measured. In earlier studies that assessed the effects of exercise on mortality, the methods utilised to ascertain the data on the amount of exercise performed was quite crude and was established subjectively. In other words, those involved in such studies were usually asked via a questionnaire how much exercise and/or physical activity do they do everyday/in a week? As you would appreciate data collected in this fashion is unlikely to be very accurate. It would not therefore be a true reflection of what participants were actually doing.

This is precisely the problem with the Katzmarzyk et al. (2003) meta-analysis that was used by Holt-Lunstad in her paper and which Pinker cites in her presentation, in that results were based on subjective determinations of exercise. More recent research has moved to much more accurate and nuanced methods to establish the magnitude and intensity of physical activity and exercise in such studies.

Devices known as accelerometers have revolutionised the objective daily measurement of exercise and physical activity. Over the last few years several studies have been published that have used accelerometers to determine objective levels of exercise/physical activity. Some of the first to use triaxial devices (capable of measuring activity along 3 planes), which increase the sensitivity for recognising physical activity, are now appearing in scientific journals and thus give us a much more insightful picture into the role or impact of exercise and physical activity on mortality (see here).

Now you may be curious or wondering, what do these studies tell us about this relationship and is it any different to the Katzmarzyk et al. (2003) meta-analysis used by Holt-Lunstad in her above graph and cited by Pinker in her TED presentation?

Let’s take a look at some of the key findings from some of these accelerometer-based studies. In brief, Lee et al. (2017) found that there was a strong inverse association between overall volume of physical activity and all-cause mortality. In fact, the magnitude of risk reduction (≈60%–70%; comparing least to most active) was far larger than that estimated from meta-analyses of studies using self-reported PA (≈20%–30%). In the Dohrn et al. (2017) study, compared with the least sedentary participants (i.e. those with the highest levels of moderate-to-vigorous physical activity or MVPA), those in the most sedentary group had an increased risk of all-cause mortality, hazard ratio: 2.7, CVD mortality, hazard ratio: 5.5 and cancer mortality, hazard ratio: 4.3. These hazard ratios are substantial. Those that spent the most time in MVPA showed huge risk reductions for all-cause mortality (over 60%), CVD mortality (almost 90%) and cancer mortality (over 80%). Evenson et al. (2016) found that having higher accelerometer-assessed average counts per minute was associated with lower all-cause mortality risk. The adjusted hazard ratio was 0.37 for those most active when compared to those most inactive; a 63% risk reduction in mortality. Results were similar for CVD mortality.

What does this mean for the graph that Pinker used in her presentation that I have been discussing. In short, a lot. The influence and impact of exercise and physical activity on mortality is far stronger than many acknowledge or give credit. Based on more recent research that is able to accurately quantify levels of physical activity and exercise, particularly MVPA, much greater promotion, awareness and utilisation (and rightly so) should be placed on one of the most powerful ways of reducing your chances of premature death. Unfortunately, this TED talk by Susan Pinker cites what is arguably outdated 15-year old exercise data that diminishes and misconstrues – to a significantly large and impressionable audience – the very strong inverse relationship that exists between physical activity and mortality. This needs to be called out, so here you go, I am calling this out as loudly as I can.

The secret to living longer may be your social life
Exercise does truly reduce your chances of dying prematurely


NB. Whilst the above blog focused on the veracity of data used, and claims made for exercise in the discussed presentation, it remains to be seen as to whether the other predictors in the graph (excluding the social relationships data) are accurate and robust. I would therefore suggest that one should be mindful of this when watching this TED talk.


For local Townsville residents interested in FitGreyStrong’s Exercise Physiology services or exercise programs designed to improve physical fitness, health and quality of life or programs to enhance athletic performance, contact FitGreyStrong@outlook.com or phone 0499 846 955 for a confidential discussion.

For other Australian residents or oversees readers interested in our services, please see here.


Disclaimer: All contents of the FitGreyStrong website/blog are provided for information and education purposes only. Those interested in making changes to their exercise, lifestyle, dietary, supplement or medication regimens should consult a relevantly qualified and competent health care professional. Those who decide to apply or implement any of the information, advice, and/or recommendations on this website do so knowingly and at their own risk. The owner and any contributors to this site accept no responsibility or liability whatsoever for any harm caused, real or imagined, from the use or distribution of information found at FitGreyStrong. Please leave this site immediately if you, the reader, find any of these conditions not acceptable.
© FitGreyStrong

Share this:

Are carbs toxic, is the CICO concept valid, can exercise facilitate fat loss? An n=1 experiment

Share this:

This before and after 6 month “transformation” was an individual experiment (n=1), which was inspired by my professional curiosity to test the validity of 5 key claims currently purported to be fundamental for improving health and body composition that I do not entirely agree with as an Exercise Scientist.

The first 3 claims are strongly and enthusiastically advanced by those that hold the view that most, if not all human beings, should severely restrict carbohydrates. This includes some carbohydrates that have traditionally been viewed as “good carbs” like, for example, sweet potato, pumpkin, parsnips, bananas, mango, apples. The fourth claim posits that saturated fat is a key driver of increased risk and incidence of cardio- and cerebrovascular disease. The fifth claim below relates to the notion that advancing age impacts the ability to alter body composition in a meaningful way – which it does – but the point is that much can still be done if the approach taken is scientifically and evidence-based.

The claims

They are, firstly, that CICO (calories in calories out) has been scientifically debunked and is not a fundamental determinant of body weight or % body fat reduction.

Secondly, that carbohydrates are metabolically toxic and bad for your health, worsening biomarkers indicative of inflammation, CVD risk and ageing such as BP, CRP, homocysteine & triglycerides-to-HDL ratio.

Thirdly, that carbohydrates sabotage and are antithetical to body fat reduction.

Fourthly, reducing saturated fat to ≤7% of total energy intake will substantially improve dyslipidemia and reduce inflammation, and hence, morbidity and mortality rates associated with vascular-related diseases.

Fifthly, that significantly increasing lean body mass or skeletal muscle tissue, and appreciably decreasing body fat in middle-aged men or women is difficult and cannot be accomplished.

Baseline-to-endpoint anthropometry & individual characteristics (25.8.16 to 17.2.17)

Age: 49

Gender: male

Height: 1.77m (5ft 10in)

Weight: 86.6 kg (191 lb) decreased to 82.4 kg (182 Ib)

Δweight = 4.2 kg (9 Ib)

BMI: 27.6 kg/m2 decreased 26.3 kg/m2

ΔBMI = 1.3 kg/m2

Waist circumference: 92.5 cm (36¼ inches) decreased to 86.0 cm (33¾ inches)

ΔWC = 6.5 cm or 2½ inches

Body fat percentage: 17.6% decreased to 10.4%

ΔBF% = 7.2%

Fat mass: 15.2 kg (33.5 Ib) to 8.7 kg (19 Ib)

Δfat mass = 6.5 kg (14.5 Ib)

Lean body mass: 71.4 kg (159 Ib) to 73.7 kg (162 Ib)

ΔLBM = 2.3 kg (5 lb)


6 month “transformation” experiment


Insights & learnings from this experiment for Gen X’ers & Baby Boomers are as follows:

1. For improvements to be seen in health and body composition, day-to-day consistency in relation to the fundamentals (what you eat and drink, regular daily exercise and good quality sleep) are paramount.

2. The NEAT effect cannot be underestimated. NEAT or non-exercise activity thermogenesis is the energy expended for everything you do that is not related to sleeping, eating and formal exercise.

Maximising NEAT – by increasing physical movement outside of formalized exercise during the waking hours (e.g. taking the stairs not the elevator, going for a walk after dinner with the family, taking regular breaks from desk-bound work etc) and decreasing time spent in sedentary activities (e.g. watching TV, playing Xbox, surfing the net, social media etc) – has a massive effect on total daily energy expenditure.

In adults, strong evidence exists of a relationship between sedentary behavior and all-cause mortality, fatal and non-fatal cardiovascular disease, type 2 diabetes and metabolic syndrome. In addition, there is moderate evidence for incidence rates of ovarian, colon and endometrial cancers.

These relationships are independent of physical activity. What this means is even if you regularly exercise, spending a lot of your other free waking time in sedentary activities is seriously harming your long-term health.

During the last 6 months I have attempted to keep moving during the day as much as I could in addition to the formal exercise sessions I was doing.

Bottomline: get up and move around for at least a few minutes for every 30-60 minutes you spend sitting or lying around.

See more here:

http://bit.ly/1W1WLUA

https://www.ncbi.nlm.nih.gov/pmc/articles/PMC4140795/


Which option do you take?


3. Resistance training was an absolute key component of this experiment. It is essential to all Gen X’ers and Baby Boomers embarking on any lifestyle-based intervention where improved health, physical function and body composition are desired.

I could write another 10,000 words just on this point alone but I will direct you to the below links for further reading that discuss the benefits of resistance training in more detail.

See more here:

http://bit.ly/1O8qUCd

http://bit.ly/1XNDlXQ


Resistance training is critically important to health and body composition (Picture: pixabay)


4. Aerobic exercise remains pivotal for all exercise-based programs designed to enhance health, function and body composition. Enhanced cardiorespiratory fitness (CRF) is one of the most powerful ways to reduce the risk of subsequent disease and research demonstrates significant risk reductions for all-cause, cardiac and some cancer-related mortality. The activities I performed very regularly were cycling, walking and a little bit of rowing.

However, whilst in a caloric deficit state too much emphasis on aerobic activity may lead to reductions in lean body mass (skeletal muscle). I would suggest therefore that the most effective programs have a good balance of resistive and aerobic exercise (50:50). Balance training/exercises for those over 60 would also be important given that the somatosensory system suffers a similar age-related decline in function. Balance can be improved provided exercises that challenge this system are undertaken.

5. Once a sufficient baseline level of aerobic conditioning is attained, I would suggest incorporating some HIIT (short for high intensity interval training).

My favorite HIIT session was an indoor-based cycling session that consisted of: 10-15 min warm-up @ 40-60% heart rate reserve (HRR) with 1 x 30 second effort @ rating of perceived exertion (RPE) 14-16; following warm-up I would perform 3 x 30 second sprint effort @ RPE 17-19 or 85-95% HRR with 3-5 minutes rest between efforts; then 1 x 4 minute effort @ 16-18 RPE or 80-85% HRR with 4 minutes rest then; 1 x 30 seconds sprint (intensity as above) with 3-5 minutes rest; 1 x 4 minutes effort (intensity as above); cool down 10 minutes & stretch.

There is an increasing body of evidence to show that HIIT is a potent, effective, time-efficient and safe form of exercise which dramatically improves many health and fitness components including but not limited to increased cardiopulmonary fitness, reductions in cardiometabolic risk factors and some preliminary data suggesting that it can attenuate the rate at which our cells age.

Interestingly, there is little consensus on whether HIIT is effective to facilitate improvements in body composition independently of dietary changes which reduce energy intake. Several recent systematic reviews and meta-analyses came to conclusions at odds to one another thus leaving this author somewhat perplexed by these disparities.

HIIT should only be performed once there is sufficient baseline conditioning but it is now accepted and utilised in many chronic disease conditions and to great effect.

http://bit.ly/1SAnzgR

http://www.heartlungcirc.org/article/S1443-9506(15)00258-9/pdf

https://www.ncbi.nlm.nih.gov/pubmed/22694349

Indoor cycling HIIT efforts


6.  I would suggest that using the concepts of periodisation and polarization of physical exercise and training are beneficial to those that have a good foundation of fitness.

Periodisation is a training concept and is applied in practice by coaches of elite athletes and/or sporting teams. Whilst it can be quite elaborate and complex at the very elite level, for the purposes of this blog and those interested in applying such ideas to their exercise plan/program, it is simply the alternation of heavier or harder periods/days of exercise/training with a recovery or lighter day/week of physical activity. What should be remembered is that you can’t smash out high-intensity exercise sessions day in day out. Such an approach will spell disaster and lead to a training implosion where you’ll either get injured, sick or burnt out. It should be noted that much of the research that has explored periodisation versus no periodisation in non-elite adults tends to show that no further benefit is achieved. Providing planned periods of recovery and rest, I believe though, are critical to successful long-term adherence and fitness/health-related outcomes.

What seems to work quite well for most 40+ year old exercisers is a 3-week on/1-week off approach; meaning 3 weeks of exercise/training that is hard/challenging followed by 1 week where you back-off and reduce the volume and intensity of the sessions. This approach also seems to work well within each training week too where you could alternate more difficult or challenging training sessions with easier and lower intensity days. For example, the week may look something like this:

Monday: Resistance training workout 1 (main movement patterns: hip dominant exercise like deadlift, horizontal push/pull exercises supersetted like bench press with bent-over barbell rows)

Tuesday: HIIT (as outlined above)

Wednesday: 1 hour easy walk (20-40% HRR)

Thursday: Resistance training workout 2 (main movement patterns: quad dominant exercise like squat, vertical push/pull exercises supersetted like shoulder press with chins)

Friday: HIIT

Saturday: 1 hour easy bike ride

Sunday: Resistance training 1

Monday: HIIT

Tuesday: 1 hour easy walk

and so on.

Polarisation on the other hand is the training concept of exercise intensity either being very challenging and intense versus light and not difficult. On a subjective rating of perceived exertion (scale 6-20), very intense exercise would be anything rated over 16 compared to something light which would be 8-11. Polarising training sessions in this way tends to assist and facilitate being able to manage and cope with the psychological challenges posed by very difficult and challenging exercise.

See here:

http://bit.ly/2oZO6rr

https://www.ncbi.nlm.nih.gov/pmc/articles/PMC3912323/

http://sportsci.org/2009/ss.htm

7. Total caloric or kilojoule intake was central to achieving reductions in body weight, or more specifically, fat mass. This experiment confirmed that body fat reduction will be achieved if an energy deficit does exist.

For a more extensive discussion and a review of the research that confirms the necessity of an energy deficit to reduce adiposity see here:

http://bit.ly/2cO54Yt

http://bit.ly/2jbnB2A

8. As shown below, I used MyFitnessPal to log my various meals. This enabled some methodology to ensure that the caloric intake was appropriate (so that I could create a calorie deficit), the macronutrient breakdown assigned was optimal to maximise fat loss whilst preserving LBM, and importantly that the quality of the diet was high.


MyFitnessPal app


Critics of “counting calories” suggest that it is virtually impossible to get an accurate daily total for both energy intake and expenditure – unless you are involved in a research study with quantifiable methods such as the doubly labeled water method, for example, to determine energy expenditure. It is therefore argued that such endeavours are futile. It is easy to see why this opinion holds sway with some given the following:

* Establishing an accurate resting metabolic rate (RMR) is fraught with difficulties and there can be significant variation in RMR even between two people with comparable anthropometrics (%BF, LBM), age and sex (see here and here).

* Assigning accurate values for energy expenditure related to exercise is likewise challenging and are more often than not, overestimated (see here).

* Trying to ascertain an activity level outside of formal exercise sessions and estimating NEAT is open to error also.

* How do you account for dietary-induced thermogenesis which accounts for about 10% of TDEE.

* There is no way of knowing that the foods and quantities that have been consumed (even if weighed) are a true representation of the calorie content of those foods and therefore reflect actual daily intake.

Whilst it may very well be true that accurately quantifying calories is a difficult task, the critics miss something that I think is fundamentally important during the process of trying to positively alter body composition. You become accountable. By attempting to measure and record daily energy intake and expenditure as accurately as possible, an acute awareness develops of how much total physical activity (including formal exercise, NEAT-type activity and sedentary behaviour) is being performed, and what and how much is being eaten.

However, even if energy intake and/or expenditure is incorrectly or inaccurately measured and recorded you now have the ability to make adjustments and tweak what is consumed or what is expended. For example, let’s assume you set an energy deficit goal of 500 kcal/day and you consistently adhere to this for period of 4 weeks but after checking your progress notice that you have not achieved any weight loss. Whether this has been caused inadvertently or not, what this basically tells you is that either total daily energy expenditure has been overestimated and/or total daily energy intake has been underestimated.

If we accept that most people are creatures of habit then we can safely assume that the foods bought and consumed on a daily and weekly basis will be roughly the same (same supermarket, same brands, same eating patterns) so there is some internal consistency regarding the calorie content of foodstuffs consumed day-to-day and week-to-week, even if the calorie content is not a true representation. With practice, one can become very adept at making the appropriate adjustments to ensure that continued progress is made.


Keeping tabs on intake is effective for many


Notwithstanding that reductions in adiposity can occur in the presence of little or no change in body mass, and increases in LBM can obscure body composition changes, the fact remains that the capacity to increase LBM is finite and if a substantial amount of body fat is shifted this will be reflected on the scales. In other words, you  rarely see someone reduce body fat mass by 20 kilograms and increase LBM by 20 kilograms; it can happen, but I have rarely seen this occur “naturally”. Therefore the use of good scales to track weight lost is a reasonable approach to take when larger amounts of fat loss are needed.

It is important to realise also that both RMR and energy expenditure for physical movement decreases commensurately with reductions in body weight so such changes need to be factored in as fat loss is achieved. As body mass decreases so to do energy requirements. If a large amount of weight loss is achieved, the caloric deficit will eventually disappear with no further weight loss realised.

For example, a 120 kg man who reduces his body mass to 100 kg will potentially reduce his resting energy requirements by almost 500 kcal and in some individuals this can be even larger and persist following weight regain (see here). These are important considerations during the weight maintenance phase given that a significant majority of people experience weight and body fat rebound.

Research does however demonstrate that those that keep tabs on their daily diet and physical acitivity levels are more successful in achieving the desired changes in body composition, and perhaps more importantly, maintaining these changes.

Finally, the claim that “counting calories” is a futile endeavour and does not lead to real changes in body composition is most strongly disputed by the ability of body builders and physique models to dramatically reduce body fat levels when readying themselves for competitions, shows or photo shoots.

It is generally well accepted that the magnitude of change in the myriad of bodily processes that regulate and  “fight against” continued adipose fat mass reduction are directly proportional to body fat percentage and the amount of actual body fat lost. In theory then, further body fat reduction – when percentage body fat is already quite low – should be extremely difficult.

What this example shows is that recording energy expenditure and energy intake as accurately as possible and creating an energy imbalance aimed at influencing and enhancing adipose tissue lipolysis is possible and extremely effective. The greatest challenge nevertheless is avoiding weight and body fat rebound following any intervention designed to alter body composition. Certainly  the evidence suggests that regular physical activity plays a fundamental role in successful maintenance of changes in body composition.

See more here:

http://bit.ly/1neiOve

9. I aimed for approximately 2 grams per kilogram body weight of high quality protein per day (160-200 grams/day).

My primary protein sources included eggs, meat, fish, chicken and FitGreyStrong’s own whey protein isolate/concentrate powder.


A special mention of whey protein is warranted. It is an excellent source of leucine. This amino acid is instrumental and has been identified as key in stimulating muscle protein synthesis (MPS) rates in the post-prandial state and following resistive exercise.

Older adults need higher levels of protein/leucine to maximally stimulate muscle protein synthesis (MPS) both at rest and following resistance exercise. Whey protein (WP) has been scientifically shown in clinical trials to significantly increase LBM and improve body composition. Recently, WP was shown to benefit diabetes by reducing postprandial glycemia and HbA1c, weight loss and satiety versus other protein sources.

FitGreyStrong now provide a high quality, leucine-rich (4 grams per serve) whey protein supplement that will help facilitate your strength, functionality, muscle gain or weight loss goals.

For more information or for purchasing options of the FGS whey protein blend see here.

There is abundant evidence to show that when in a caloric deficit state, a diet higher in protein helps preserve skeletal muscle tissue (lean body mass). This is critical because the loss of muscle tissue negatively affects strength, physical function and will reduce basal or resting energy expenditure.

It is the long-term implications, however, that reduced skeletal muscle has on health, strength, mobility and functionality that are of a real concern. Researchers with expertise in this area now concur that for older adults 0.4-0.5 grams of protein per kilogram of body weight per main meal is required to ensure that post-prandial muscle protein synthesis (MPS) is maximised thus attenuating the loss of skeletal muscle with ageing over time.

See more here:

See Professor Stuart Phillips discuss the importance of protein here.

http://bit.ly/1QSSUsT

http://bit.ly/2qPc8pv

https://www.ncbi.nlm.nih.gov/pubmed/27086196


High-quality protein is essential for preserving skeletal muscle tissue


10. For carbohydrates I aimed to consume 2-3 grams per kilogram body weight per day. In absolute terms, this varied from around 170 to 240 grams/day with consumption of simple sugars from whole foods varying from 40-80 grams/day.

These primarily consisted of cellular carbohydrates and acellular carbs, whilst not excluded, were minimised. Examples of cellular carbs were sweet potato, pumpkin, kale, zucchini, carrot, apple, berries, banana whilst examples of acellular carbs are bread, bagels and rice.

See more here:

https://www.ncbi.nlm.nih.gov/pmc/articles/PMC3402009/

I continued to eat honey (10 grams/day) in my morning smoothie (frozen berry, whole milk, whey protein, peanut butter, LSA) after my exercise sessions. I also didn’t completely eliminate added sugar indulging in 1-2 teaspoons of raw sugar in the occasional bowl of porridge. Nonetheless, added sugar from table sugar or derived from foods more highly processed were kept to a minimum.

The question is, of course, are carbs ‘toxic’ to health and do they thwart attempts to alter body composition? I very much doubt it but I need to caveat this statement with some comments.


Some believe these foods are fattening and toxic to health


Many factors modulate individual tolerability in response to dietary carbohydrates and the propensity to induce adverse health outcomes and worsening adipose-related body composition. Whilst not a finite list, chronic overnutrition and an energy surplus state, the amount of carbs, the type or source, when they are consumed in a meal, sleep patterns, stress, physical activity levels, the FITT makeup of weekly exercise sessions, sedentary behaviour patterns, age, metabolic and skeletal muscle/mitochrondrial health and genetics all interact and play a role in relation to individual tolerability. What may suit one person, may be metabolically problematic for someone else. Whilst it is not my intention to explore all these factors in depth there are a few key points worth acknowledging.

Research investigating the affect of genes to different macronutrient-based diets suggests that individual response varies substanitally so the idea that there is a particular diet template that suits everyone is therefore a myth. It is clear that genes interact with diet which necessitates individual experimentation, and trial and error to establish what is most suitable regarding the proportionate breakdown of macronutrients.

See more here:

http://bit.ly/29TXs1S

http://go.nature.com/29Q36RC

https://www.ncbi.nlm.nih.gov/pmc/articles/PMC5330198/

http://care.diabetesjournals.org/content/36/11/3442

Manipulating the sequence of fat and protein ingested before carbohydrate can potentially reduce postprandial hyperglycemia. In type-2 diabetes patients, altering the sequence whereby carbs are consumed before or only after after high-protein and high-fat foods at each main meal (lunch & dinner), elicited the same weight loss but very difference effects on HbA1c, fasting plasma glucose, postprandial glucose excursions and other indices of glucose variability.

See more here:

http://www.nature.com/nutd/journal/v6/n8/full/nutd201633a.html

Increasing protein and swapping out carbohydrate for increased dietary fat should be considered and warranted in prediabetes and diabetes. For example, a recent study showed that after 6 months on a high-protein (HP) diet, 100% of the subjects involved had remission of their prediabetes to normal glucose tolerance, whereas only 33.3% of subjects on the high carbohydrate (HC) diet achieved remission. The HP diet group exhibited significant improvement in (1) insulin sensitivity (2) cardiovascular risk factors (3) inflammatory cytokines (4) oxidative stress and (5) increased percent lean body mass compared with the HC diet at 6 months.

This is the first dietary intervention feeding study, to the authors knowledge, to report 100% remission of pre-diabetes with a HP diet and significant improvement in metabolic parameters and anti-inflammatory effects compared with a HC diet at 6 months. It should be noted that the HP diet was also lower in carbs compared to the HC diet so the superiority of the HP diet inducing remission of pre-diabetes in participants cannot be solely ascribed to increasing dietary protein. What these results suggest is that prediabetes is most effectively treated (with respect to the diet component of the intervention) by concomitantly as a percentage of total energy intake, increasing dietary protein to ≥30%, whilst simultaneously reducing carbohydrates to ≤40%.


Could more of this be a boon for health?


Diets that reduce carbohydrate and increase dietary protein and fat generally elicit improvements in those suffering impaired glucose regulation and diabetes, including but not limited to, glucose tolerance, FBG, HbA1c, insulin resistance, insulin sensitivity, dyslipidemia, HDL-to-triglyceride ratio and hyperinsulinemia. It is therefore a case in point that when I ask the question – are carbs toxic? – the answer is going to depend on many factors as I alluded to above and needs to be considered in context.

Indeed for those that have serious metabolic impairment (i.e. type-2 diabetes) and significantly reduced capacity to dispose of glucose post-prandially plus an inability to adequately stabilize blood glucose to acceptable concentrations across the day, cellular carbs may even present tolerance problems for some. As such, this may necessitate a need to reduce and minimise all types of carbs to ensure maximal improvements in blood glucose regulation.

See more here:

http://bit.ly/2pS3adB

If carbohydrate reduction – in those with pre-diabetes and diabetes – yields the most favourable changes in metabolic biomarkers, does this therefore mean that everyone should be reducing carbohydrates to very low levels?

This raises one of the central questions that I was trying to explore with this n=1 experiment.

That is, would a primarily high quality carbohydrate intake 35-40% of energy intake (170-240 g/d) impair my health and stall changes to body composition?

Lastly, it is important to point out (see herethat total energy intake will modulate, to some degree, carbohydrate tolerability. An energy deficit or energy surplus state will have a profound effect on metabolism and glycaemia.

11. For dietary fat, I aimed for 1-1.5 grams per kilogram body weight per day. This was derived from nuts, seeds, pepitas, avocado, peanut butter, olive oil, coconut oil, LSA. Fat (mainly saturated fat) from full fat dairy foods (milk, cheese, yoghurt) was also consumed. Saturated fat from some of the protein sources (meat and eggs) was also not minimised. Saturated fat consumption as a percentage of total energy intake per day was around 15%, which is at least double and well above the recommended ≤7% per day. Fatty fish (salmon, sardines, mackerel) was consumed 2-3 times/week to ensure a decent intake of omega-3 long-chain fatty acids, EPA (eicosapentaenoic acid) and DHA (docosahexaenoic acid).

For those that have known me for a while, I have held the view for over 20 years now that saturated fat is not a primary instigator of atherosclerosis, coronary heart and cerebrovascular diseases. After a careful and continued assessment of the evidence over this time, my opinion has not shifted.

There is no convincing evidence that reducing saturated fat to ≤7% of total energy intake – from say double or even triple that – has any meaningful effect on all-cause mortality rates. I continue to remain unimpressed by the evidence used to justify the position that saturated fat is atherogenic. Interventional research, where the intake of saturated fat is modified and decreased, results in little change to future morbidity or mortality. In some cases, such reduction has in fact been counterproductive and manifested in higher rates of morbidity and mortality.

See more here:

https://nutritionj.biomedcentral.com/articles/10.1186/s12937-017-0254-5

http://www.bmj.com/content/353/bmj.i1246

bit.ly/2i14pUu

http://bit.ly/2pS3adB

http://stroke.ahajournals.org/content/35/7/1531.short

A recent interventional study showed that consuming energy primarily as carbohydrate or fat (34% of energy from saturated fat or nearly 5 times the recommended limit) for 3 months did not differentially influence visceral fat and metabolic syndrome provided the diets were low-processed and lower-glycaemic based. Furthermore, in recent years, scientific evidence has increased concerning the ability of lipids, in particular omega-3 polyunsaturated fatty acids (n-3 PUFAs), to positively influence muscle and overall physical function in older patients.

Bottomline: quality counts!!

12. My daily macronutrient breakdown based on caloric energy intake (EI) was approximately 25-30% protein, 35-40% carbohydrate, 30-35% fat. The percentages for the carb-to-fat ratio would vary day-to-day, some days higher in carbs, other days higher in fat, but protein would come in close to the 2 grams/kg body weight (∼30% of EI) each day. Simple sugars consumed per day varied from 40-80 grams.

I would describe this type of nutritional approach as an energy deficit, high-protein, moderate carb, moderate fat diet based on non-processed foods.

13. The picture below is a snapshot of my blood tests and is provided as evidence to demonstrate that for my physiology, the lifestyle-based intervention was very effective. All biomarkers were excellent and those indicative of inflammation were very low. Blood pressure measured 122/70 and was normal for the duration of the intervention.


Blood test health biomarkers


Summary

In summary, this n=1 experiment confirmed that improvements in health and body composition, with decreased body fat and increased lean body mass, can be achieved in a 49 yo middle-aged male. Consuming 35-40% of the diet as carbohydrates (170-240 grams/day) containing 40-80 grams/day of simple sugars, 2g/kg/d of protein or 25-30% (160-200 grams/day) and 30-35% fat (with 15% of energy intake derived from saturated fat), was effective and safe with no ill effects. Biomarkers measured through blood tests corroborated this.

Physical activity – both formal exercise sessions and increased NEAT – was an integral component of this experiment. Finally, I would like to finish by saying to all those that read this blog to continue partaking in resistive exercise 2-3 times/week or for those not doing any such exercise to seriously consider adding this to your weekly routine. The benefits over the long-term go well beyond any words I can write.


Disclaimer: All contents of the FitGreyStrong or FGS website/blog are provided for information and education purposes only. Those interested in making changes to their exercise, lifestyle, dietary, supplement or medication regimens should consult a relevantly qualified and competent health care professional. Those who decide to apply or implement any of the information, advice, and/or recommendations on this blog or the FGS website do so knowingly and at their own risk. The owner and any contributors to this site accept no responsibility or liability whatsoever for any harm caused, real or imagined, from the use or distribution of information found at FitGreyStrong. Please leave this site immediately if you, the reader, find any of these conditions not acceptable.

© FitGreyStrong


Share this: