The results of a study conducted by Dr Kevin Hall and 10 other researchers titled “Energy expenditure and body composition changes after an isocaloric ketogenic diet in overweight and obese men” were published recently in the American Journal of Clinical Nutrition. Many interested in this area had waited patiently in anticipation wondering just what Dr Kevin Hall and co would discover given that this study attempted to answer several claims that are presently in dispute. The carbohydrate-insulin model of obesity and low carbohydrate diets have gathered greater traction in recent times. Hall’s study was designed to investigate if there was any foundation to the key tenets of this theory and ascertain whether greater increases in energy expenditure and reduction of body fat were elicited when following a low carbohydrate diet.

A number of key claims which underpin this model are made by those advocating low carbohydrate diets. Firstly, that by decreasing the proportion of carbohydrate in the diet a concomitant reduction of insulinemia will ensue, and in so doing, cause increased fat mobilisation from the adipose tissue thus causing a greater oxidation of circulating free fatty acids (FFAs). Insulin is viewed in this context as the ‘gate-keeper’ of whether fat is partitioned toward storage (higher insulin) or mobilised and oxidised for energy metabolism (lower insulin). Secondly, as a consequence of reduced insulin secretion and increased availability of FFAs for use by metabolically active tissue, very low carbohydrate (VLC) or ketogenic diets will disproportionately increase energy expenditure compared to isoenergetically-matched low fat, high carbohydrate (HC) diets. Thirdly, it is concluded that ‘a calorie is not a calorie’ therefore, because energy expenditure and body fat metabolism will be impacted in a different and advantageous manner by exchanging an isoenergetic amount of dietary carbohydrate for fat.
The subsequent published findings left a lot of people with their noses seriously out of joint and Dr Hall was showered heavily with criticism. In fact, some were so dismayed with the authors interpretation of the study’s results that the rebuttals transcended professional criticism with personal attacks and slurs directed at the lead author himself. There were even suggestions made by some that there was a conspiracy amongst researchers, research agencies, government and the food industry to misconstrue the study’s findings. Essentially, these 11 researchers concluded that a VLC diet was no more effective compared to a HC diet for reducing body fat. Small increases were detected in energy expenditure for the VLC diet but this was dismissed as clinically irrelevant.
It is perhaps worthy to note here that those involved in this study represent some of the most well known, credentialed and respected obesity researchers worldwide. The claim therefore that these authors are misrepresenting or misconstruing the data of this study – to maintain some sort of high carbohydrate diet ‘status quo’ which is further exacerbating the obesity and growing diabetes problem – is preposterous. I don’t think they are endorsing any such thing but I will have more to say about this in a later blog (see below).
See Dr Hall’s interview below at the 2016 World Obesity Federation where he presented a poster of the authors interpretation of the study’s data and results prior to full publication of the trial.
Before I review the Hall trial in greater detail however (part 2), there is another study published in 2012 that played a pivotal role and led the way in consolidating the view that ‘a calorie is not a calorie’ after producing results that were distinctly different to the Hall study. To provide context to the criticism launched at Dr Hall, we must first understand how the results of the Ebbeling study influenced and framed up the discourse that currently exists regarding diet type and obesity. The Ebbeling trial is perhaps one of the most influential publications of recent times within the field of nutrition and obesity management and compares the effects of 3 diets differing widely in macronutrient composition and glycaemic load on energy expenditure following weight loss. It is often referred to by those claiming the existence of a ‘metabolic advantage’ for VLC diets with weight or fat loss purported to be substantially easier and significantly greater than diets higher in carbohydrate. The abstract and summary of the study can be viewed below.
So what were the findings and what did the Ebbeling study conclude?
Results of the Ebbeling Trial
Key findings: In overweight and obese young adults that achieved 10-15% weight loss, significantly greater reductions in resting energy expenditure (REE) and total energy expenditure (TEE) were found for weight loss maintenance diets in the following order → low-fat (LF) diet > low-glycemic (LGI) diet > very low-carbohydrate (VLC) diet, when compared to pre-weightloss energy expenditure. In fact, the difference between the LF and VLC diet for TEE equated to approximately 300 kcal/d (LF diet -423 kcal/d versus VLC diet -97 kcal/d)! This is a remarkable difference and as the authors allude to, corresponds (approximately) to the amount of energy expended during 1 hour of moderate-intensity physical activity. If valid, this would constituent a very substantial ‘metabolic advantage’ in the treatment of obesity and the widespread adoption and encouragement of VLC eating practices would be justifiable. I should make it clear that it is not my intention to argue against the benefits of VLC diets given that the scientific evidence and anecdotes show them to have helped many people successfully lose weight and improve metabolic biomarkers of health. I do, nonetheless, wish to challenge the validity and generalisability of the results of the Ebbeling trial where it is claimed that a ‘metabolic advantage’ existed for the VLC diet with much higher readings for energy expenditure following weight loss.

Problems with the Ebbeling Trial
The fundamental problem with the findings of this study is that there is significant heteroscedasticity for energy expenditure and diet type. In other words, whilst the pooled data of all participants showed that the VLC diet demonstrated less reduction in REE and TEE compared to the other diets, at an individual level the effect of diet type on REE and TEE was unpredictable and lacked any reliability to predict what diet would be most suitable when, where and in whom (see graphs below).
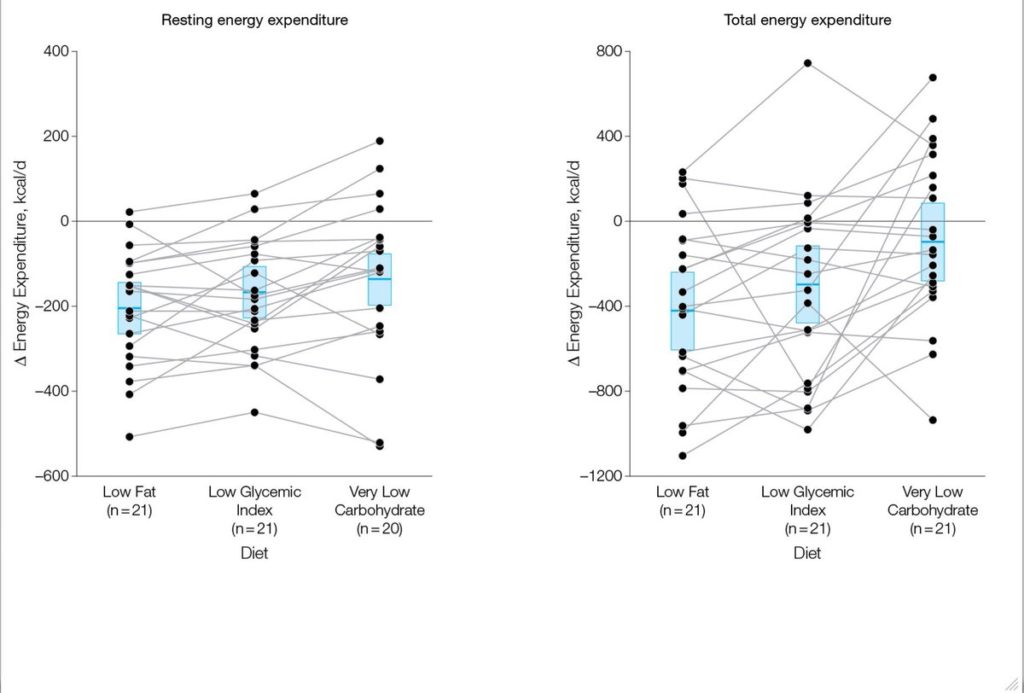
Assessment of the pooled versus individual data indeed raises more questions than answers. There are several problems in reconciling the key findings of the study against individual data presented in the graphs above (Figure 3, pg 2632).
The magnitude of difference in TEE between the 3 diets of some participants seems highly dubious. For example, there is one participant that recorded approximately -900 kcal/d versus +400 kcal/day for TEE, on the LGI and VLC diets, respectively. A whopping difference of ∼1300 kcal/d! Such a difference is fanciful as it would exceed the energy an average person would expend following a 3 hour run. Anyone that seriously believes that a 1300 kcal/day difference can exist for an isoenergetically-matched low vs high carbohydrate diet is deluding themselves. This is simply science fiction!
There are several other participants too where the differences recorded for the LGI vs VLC diets are very large indeed (i.e. ∼ 925, 850, 725, 650). Such large disparities I would contend defy or exceed what is humanly possible – physiologically speaking – on a chronic, long-term basis. Clearly, the data for these participants are outliers and they should have been excluded.
If such differences do indeed exist, the strongest and best long-term evidence suggests that metabolic adaptation can occur over the short term – meaning REE can differ between macronutrient manipulated isoenergetic diets – but over the longer term this difference disappears. Thus if there is any ‘metabolic advantage’ to higher protein or VLC diets because of their higher thermic effect or effect on satiety, this has not translated into meaningful greater weight loss over 24 months in free-living people that are overweight or obese (see here & here).
Presumably, the striking difference recorded for the VLC diet for TEE is being driven and skewed by 5-6 participants who recorded these exceptionally large values. If we exclude these outliers from the VLC diet group, the differences between groups is substantially reduced and brought much closer together.
Inflammatory biomarkers as measured by 24-hour urinary cortisol excretion and C-reactive protein were both highest for the VLC diet compared to LF and LGI diets. It is not clear whether these differences are clinically relevant or if there are any long-term health implications. Increased inflammation is certainly not ideal so it would be prudent to monitor those that adhere to such diets; notwithstanding that other studies have shown the opposite with inflammatory biomarkers decreasing on VLC diets. Given that increased REE and TEE occurred concomitantly with raised cortisol and CRP however, it would be interesting to know if those individual’s that recorded the highest values for REE and TEE, also recorded likewise, high values for both inflammatory biomarkers. If that was the case, it would be reasonable to suggest that the propensity of some people to record substantially higher REE and TEE may be more symptomatic of some type of disordered physiological or metabolic side-effect of the VLC diet, perhaps modulated by genes. This could possibly be a negative not positive bioeffect of VLC diets.
The pattern of effect on TEE at an individual level does not concur with the overall results of the study. For example, 8 participants of 21 recorded greater reductions in TEE during the VLC diet when compared to the LGI diet. Consequently, it is problematical to suggest that VLC diets provide a novel bio-effect that is reliable and consistent in all people. It is a curiosity as to why this was not discussed and no effort was made to appropriately contextualise these findings.
A similar pattern existed for the REE data with 1 subject having higher REE for LF and LGI diets vs VLC, 2 subjects having higher REE for the LF diet vs LGI and VLC diets, 3 subjects having higher REE for the LGI diet vs LF and VLC diets and 3 subjects where there was little difference between the LGI and VLC diets. In total, 9 of 20 did not respond in a way commensurate with the pooled study REE data (data for one VLC REE has been excluded, presumably due to being identified as an outlier). Once again there were a select few of the study cohort that had very large REE measures for the VLC diet vs the LF and LGI diets.
Whilst trying not to be overly skeptical, the data of one person that was excluded from the VLC group for REE (see figure 3 with VLC diet n=20 vs LF n=21 & LGI n=21), is an interesting omission. The only reason I say this is because I find it hard to fathom why it was ok to include, for example, the participant on the VLC diet whom had a 1300 kcal/d difference in TEE data (as discussed above), but then to omit REE data for one VLC participant as an outlier (maybe on the low side?) appears rather too convenient.
Weight loss is well known for reducing energy expenditure. In the Pounds Lost study by Jonge et al. (2012), for example, resting energy expenditure in men at 6 months decreased by 99.5±8.0 kcal/d and was accompanied by weight loss of 7.6±0.34 kg. There were no differences between any of the diets – that ranged from lower to higher in carbohydrates – on either REE or weight loss.
However, despite the results of this study being at odds to the Ebbeling trial, it is not this dissimilarity I am interested in; despite the fact that there are obvious questions that spring to mind as to why this would be the case. No, what I am particularly interested in is the REE values recorded during the weight loss maintenance phase. Given that a mean weight loss of 14.3 kg was achieved and this corresponded to 13.6% of baseline body weight, significant reductions in REE occurred as expected. Unfortunately we do not know what the actual pooled or individual reductions were in REE over the 12 week weight loss period as REE was only measured at baseline (before weight loss intervention) and during the final 3 days of each study diet. These data for weight loss-induced reductions in REE would have been of benefit to ascertaining what changes occurred in REE after a 12-week weight loss program and what effect, if any, the 3 test diets subsequently had on REE after each 4 week diet.
Based on the significant mean weight loss of 14.3 kg achieved over the 12 week run-in phase and on previous studies that have tracked REE in relation to weight loss, 200-300 kcal/d would be a fair estimate for mean REE reduction. It is especially impressive, then, that some participants were apparently able to offset such reductions and actually increase REE above baseline values during the weight maintenance phase (assuming all participants achieved appreciable weight loss). Five participants recorded REE values that either remained unchanged or exceeded baseline for one or more of the 3 test weight maintenance diets.
One subject had increased REE compared to baseline for all diets, most notably for the VLC diet which was almost 200 kcal/d higher than baseline. Another subject had slight increases in REE for LGI (approx 20 kcal/d) and VLC diets (approx 50 kcal/d). An approximate 100 kcal/d increase over baseline for the VLC diet was observed in another participant. Whilst a fourth person had a slight increase on the VLC diet of approx 20 kcal/d. And finally, the fifth subject showed little change in REE for the LF diet compared to baseline REE. The fact that there were any increases at all, let alone a couple of participants that had increases of 100 to almost 200 kcal/d after substantial weight loss, is astonishing. Such results, if valid and replicable warrant serious investigation. Why these participants were able to increase or keep REE stable after significant weight loss is of great interest, as the reduction of REE in previous studies has been shown to be relatively proportional to the magnitude of weight loss.
Following each test diet it is surprising that body weight did not differ significantly following each 4-week study period given the differences, as reported above, between study diets for both REE and TEE.
I find the arguments advanced by Dr Ludwig in his response to Dr Hall’s critique of the Ebbeling trial in relation to this not particularly convincing either (see here). Body weight can fluctuate over the short term and things such as hydration and the amount of stool in the colon can influence weight. Nevertheless, after 4 weeks of each study period unless there were wild fluctuations in diet, lifestyle factors or a confounding medical condition – and there is no evidence that this was the case – these things would have been fairly stable and consistent by this stage. This explanation that all participants in the VLC diet were better hydrated and/or had not completed a bowel movement compared to the LF and LGI diets, and it is this that can explain the lack of difference in weight, is a fallacious argument, improbable and can be dismissed. In fact, in short term studies investigating VLC diets you will see larger initial decreases in body weight compared to diets higher in carbohydrates due to the reduction of muscle (water-laden) glycogen as described by Kreitzman et al (1992) (see here).
Moreover, I find the ‘substrate partitioning favouring lean tissue’ proposition a big stretch. Substrate partitioning has certainly been shown to occur during energy surplus/overfeeding (see 1, 2, 3, 4), energy deficit/underfeeding (5, 6, 7) and during intensive resistance training and anaerobic high-intensity exercise intervals (see 8 & 9).
These situations though are vastly different to a state of energy and macronutrient balance, as would have occurred in each 4-week diet period, where the intake of dietary carbohydrate, fat, and protein is matched by their rates of utilization (see here). Notwithstanding the results of the Pawlak study in rats, where a low glycaemic diet and reduced insulin secretion (versus a high glycaemic diet) showed substrate partitioning in favour of lean tissue, there exists no evidence in the short term for this occurring in humans during energy balance.
Provided sufficient protein was ingested to ensure nitrogen balance (which all 3 diets did; 104.8g/1.2g per kg BW, 105.5g/1.2g per kg BW & 151.5g/1.7g per kg BW, for the LF, LGI & VLC diets, respectively), it is implausible that a significantly greater increase in LBM and decrease in fat mass would have occurred in the VLC diet versus the LF and LGI diets during energy balance.
As the participants were not engaged in any concurrent intensive exercise or resistance training intervention, the physiological stimulus to induce the substrate partitioning like seen in reference 8 & 9 above did not exist either.
Final comments
The results of the Ebbeling study suffer from internal inconsistency and there is an inability to reconcile the data at hand. The variability in the individual data for diet type and their effect on energy expenditure is discordant to that of the pooled data thus invalidating the generalisability of the results. To truly make the claim that a novel bio-effect exists for a particular diet type, a consistent, reliable pattern of response should be reproducible in a majority of people. The fact of the matter is that no such effect was shown in the Ebbeling trial. The notion, then, that the VLC diet was shown to provide a ‘metabolic advantage’ is repudiated.
Watch out for “The Ebbeling vs. Hall Trials: Re-visiting How Diet Affects Energy Expediture And Weight Loss – Part 2” (see here) which will discuss in more detail the results of the study headed up by Dr Hall titled: “Energy expenditure and body composition changes after an isocaloric ketogenic diet in overweight and obese men” that were published recently in the American Journal of Clinical Nutrition and explore some of the reactions to this.
Disclaimer: All contents of the FitGreyStrong website/blog are provided for information and education purposes only. Those interested in making changes to their exercise, lifestyle, dietary, supplement or medication regimens should consult a relevantly qualified and competent health care professional. Those who decide to apply or implement any of the information, advice, and/or recommendations on this website do so knowingly and at their own risk. The owner and any contributors to this site accept no responsibility or liability whatsoever for any harm caused, real or imagined, from the use or distribution of information found at FitGreyStrong. Please leave this site immediately if you, the reader, find any of these conditions not acceptable.
© FitGreyStrong

